
My Dashboard
Enj-Dashboard helps monitor the health of processes by collecting, assimilating and analyzing process metrics as transactions are executed, and these are available for analysis and process optimization.
Company Administrators on Enj can access this powerful reporting module that allows them to run system level queries to find how the system is performing and identify and optimize bottlenecks in the processes. Each of these queries allows drill-down to the transaction level so that investigations can be completed quickly and effectively.
Throughput Queries allow you to see how many transactions have passed each point in the process. This gives a quick measure of the pulse and utilization of the system. Status Queries show how many transactions are pending at each stage. This gives a measure of the bottlenecks and a quick indicator of the activities that need to be optimized in terms of resources allocated to them.
System Performance queries give overall performance benchmarked against Standard Times assigned at the time of process definition and this information is vital to streamline the process, speeding up slow activities and (maybe) taking resources off the faster ones so that the process is balanced and there is no bundling up of transactions.
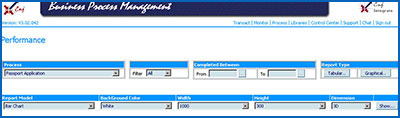
All these reports are available either in tabular form or in easy to visualize graphical form.
Company Administrators on Enj can access this powerful reporting module that allows them to run system level queries to find how the system is performing and identify and optimize bottlenecks in the processes. Each of these queries allows drill-down to the transaction level so that investigations can be completed quickly and effectively.
Throughput Queries allow you to see how many transactions have passed each point in the process. This gives a quick measure of the pulse and utilization of the system. Status Queries show how many transactions are pending at each stage. This gives a measure of the bottlenecks and a quick indicator of the activities that need to be optimized in terms of resources allocated to them.
System Performance queries give overall performance benchmarked against Standard Times assigned at the time of process definition and this information is vital to streamline the process, speeding up slow activities and (maybe) taking resources off the faster ones so that the process is balanced and there is no bundling up of transactions.
All these reports are available either in tabular form or in easy to visualize graphical form.